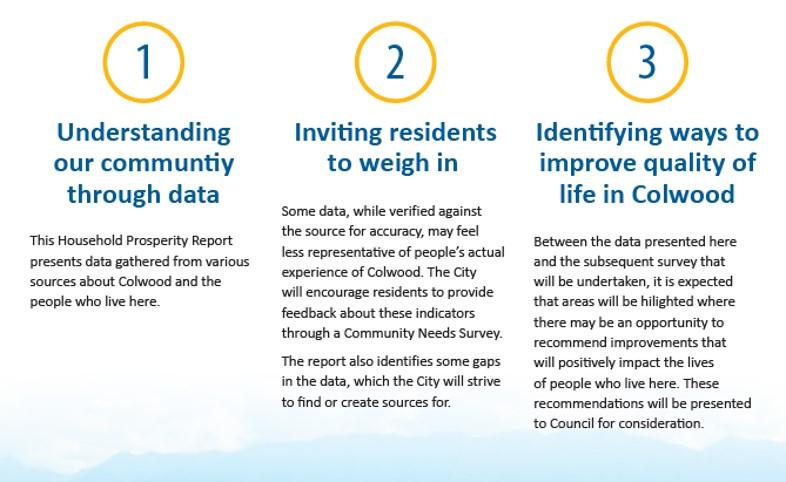
Gathering quantitative data in a Household Prosperity Report
Household prosperity considers economic factors such as income, housing and education, but also the social, cultural and environmental aspects that contribute to well being and quality of life.
In 2023, the Community Social Planning Council prepared the Colwood Household Prosperity Report you can read about below. It was adopted by Council in May 2023, along with direction to conduct a survey to ground truth the data by encouraging residents to share their experience and perspectives about the information presented in the report, and about life in Colwood.
Surveying Residents to Gain a Deeper Qualitative Understanding

Ground-truthing the data gathered from the 2023 Household Prosperity Report [PDF/8.6MB], along with recent findings from the Ideas Fair and Citizen Satisfaction Survey, will help the City make informed decisions that focus on creating a thriving community with housing choices, employment, transportation options, and facilities that encourage a healthy lifestyle that includes recreation, cultural and social connections.
The Household Prosperity Survey conducted by Angus Reid Group gives residents the opportunity to share their experience and perspectives through qualitative data, which will further enhance the City's ability to align decisions with data that specifically targets quality of life in Colwood.
The survey will ask questions that delve deeper, for example: What is your experience of Colwood as it grows, with respect to diversity, friendliness, social connections and the energy of the community? Does your current housing situation support or detract from your quality of life? Do you spend more time commuting than you would like? What would help you be able to live AND work in Colwood?
Results of the Household Prosperity Survey
Survey findings from the nearly 500 responses were presented to Colwood Council on January 8, 2024 by the research team from Angus Reid Group. A third of respondents agreed to be contacted for an interview to share additional insights about life in Colwood.
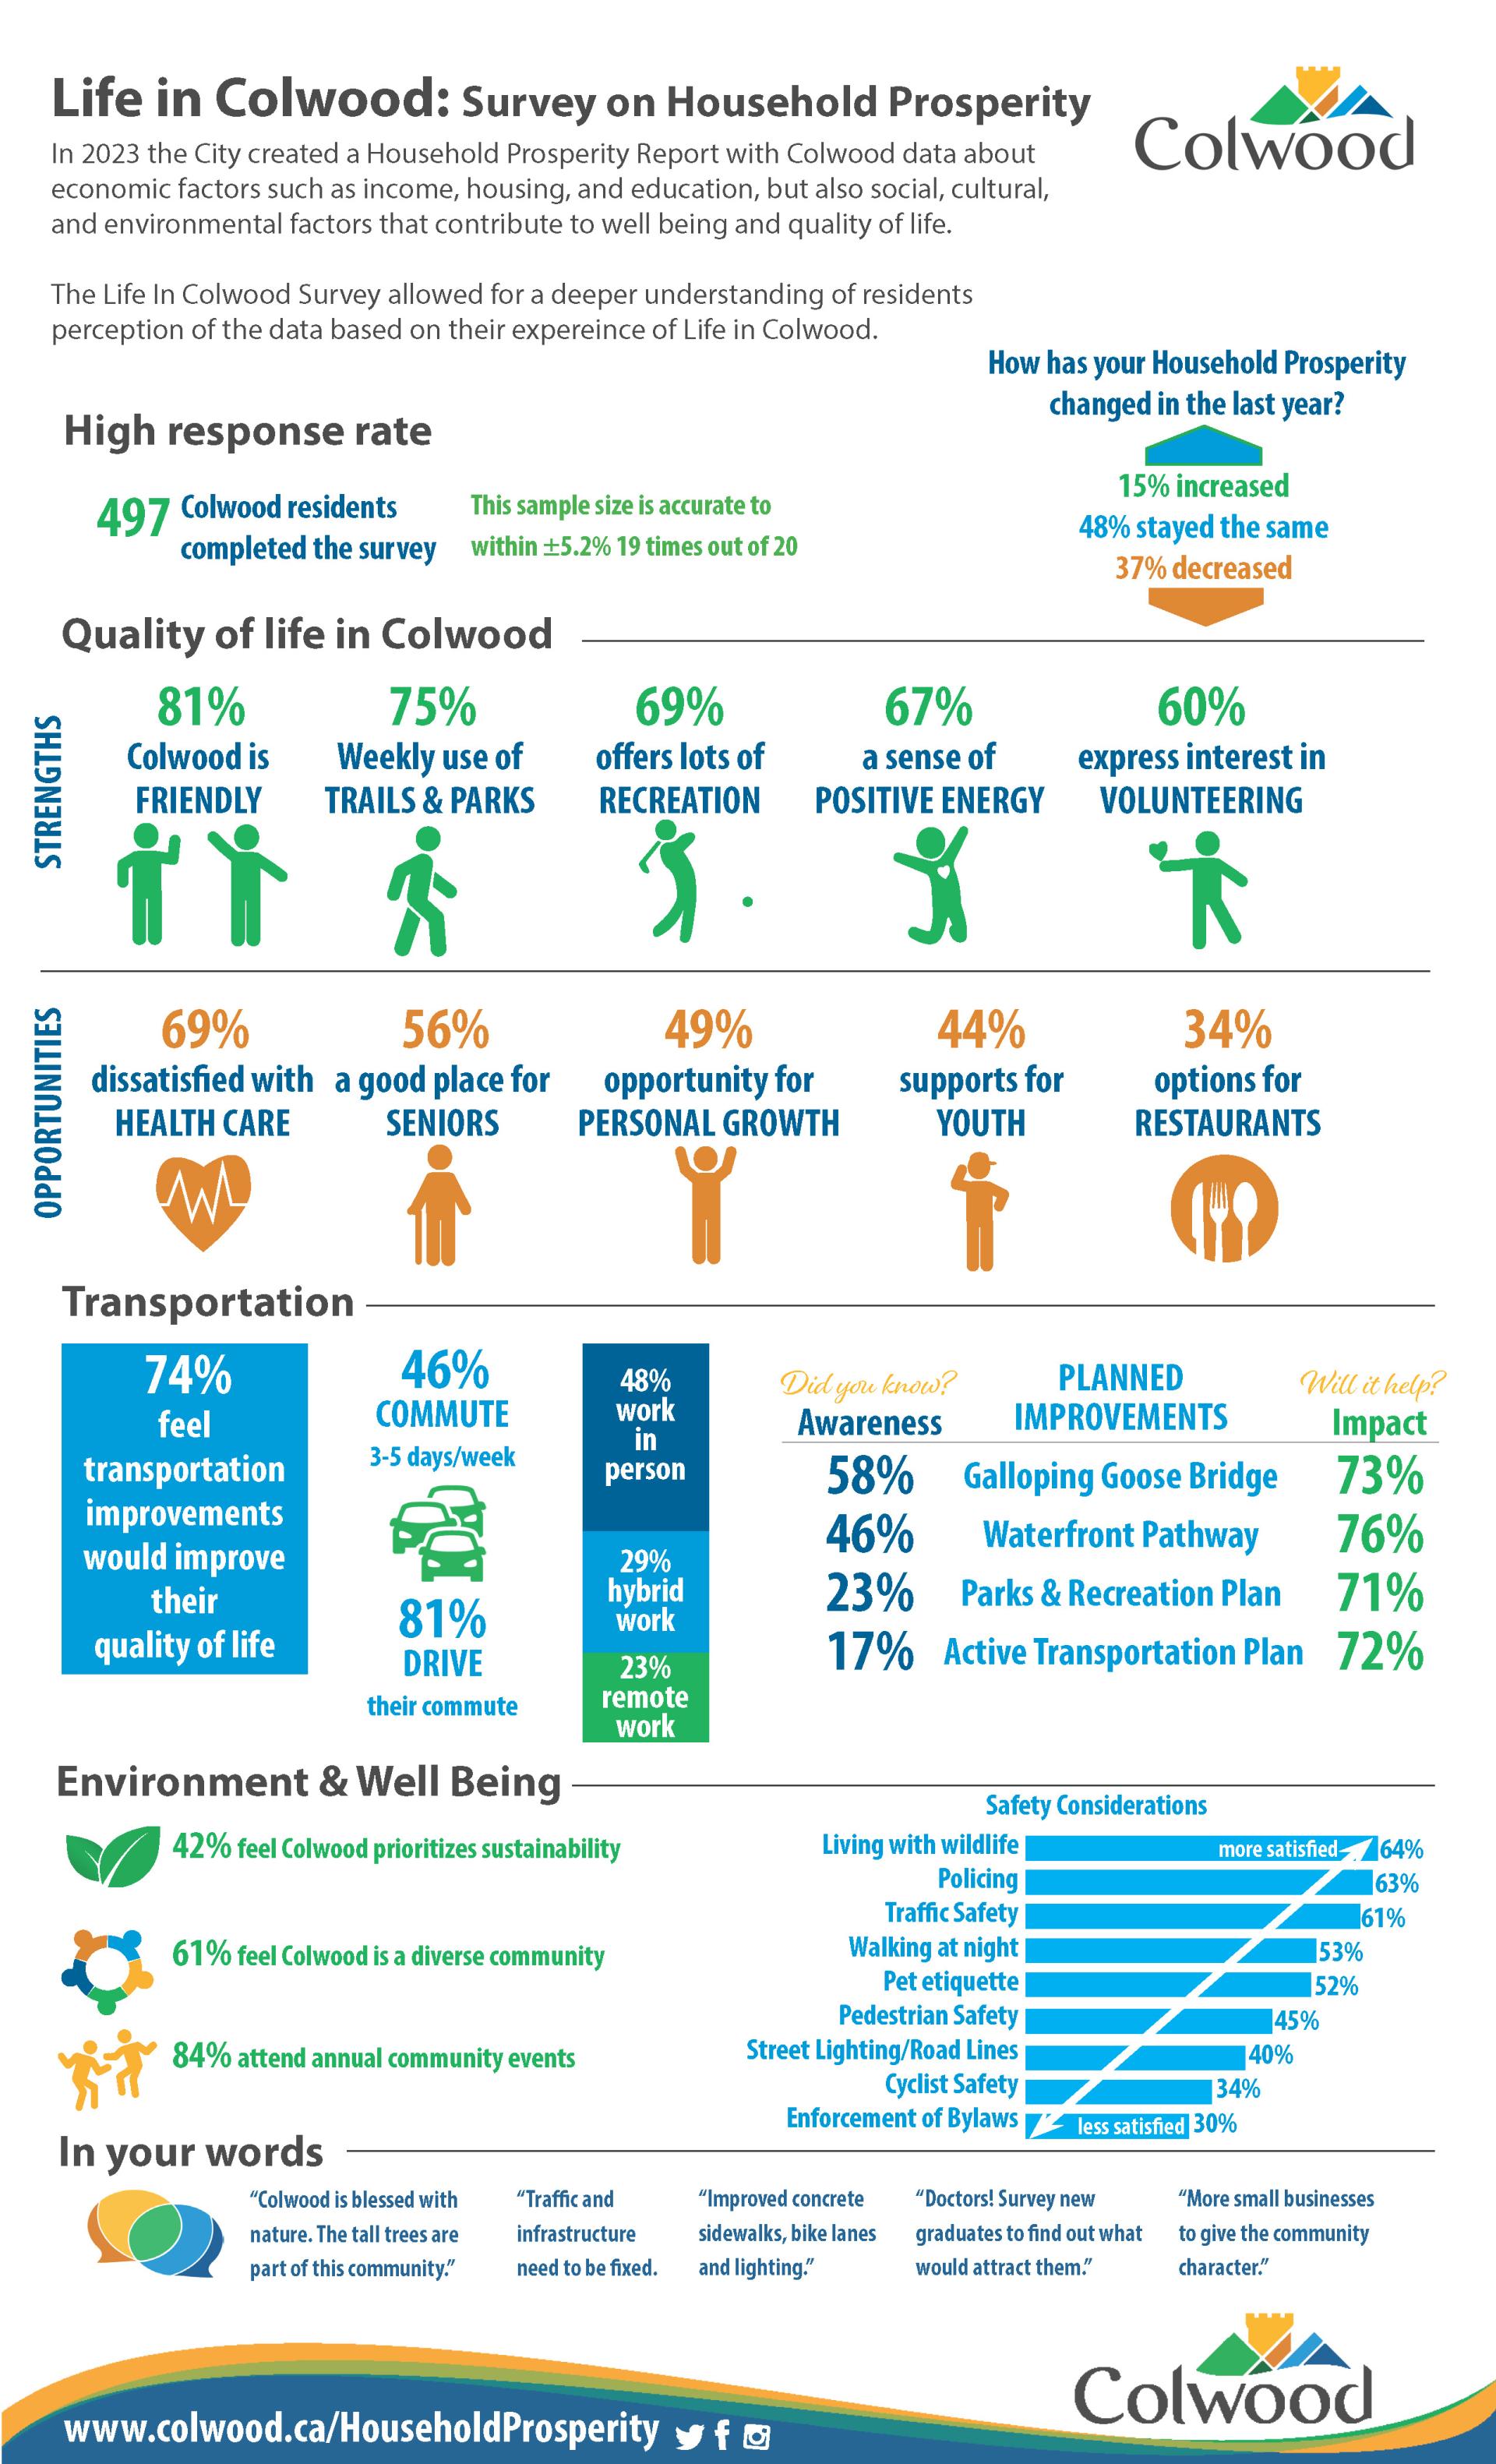
Review the full Angus Reid presentation of survey findings.
The next step will be to have deeper conversations with people about areas that aren't as clear. How do perceptions differ for various age groups, home owners versus renters, or from neighbourhood to neighbourhood, for example. More than 150 survey respondents offered to participate in follow up interviews.
Household Prosperity Report Findings of Interest
The 2023 Household Prosperity Report [PDF/8.6MB]offers important insights that help the City understand the current state of our community through data. For example:
- A growing and aging population: Colwood’s population of approximately 20,000 people grew 12.5% from 2016 to 2021 and continues to grow. The median age in 2020 was 42.4 up from 40.1 in 2010.
- Higher than average incomes: Colwood’s median income ($102,000) is higher than Langford ($93,000) and the CRD ($84,000), with 40% of homes in the higher income bracket of $120,000+.
- High home ownership rates: 73.5% compared to Langford at 64.8% and the CRD at 62.9% and the average dwelling value increased 54.7% between 2016 and 2021. The Ideas Fair also identified seniors housing and youth housing as a priority.
- Increasing number of renters: The number of tenant dwellings in Colwood increased from 1,735 in 2016 to 1,980 in 2021.
- Hard workers: Colwood’s unemployment rate is 5.1, stronger than Langford at 6.2, CRD at 6.8 and BC at 8.4 with a higher average number of weeks worked (43.1) in 2020 than Langford, CRD and BC.
- Making the most of education: A higher number of Colwood residents are high school, trades and college educated and fewer have university degrees than Langford, CRD and BC
- Opportunities to improve active living: Despite connections to nature with 89.6 hectares of parkland (5.3 ha per 1,000 residents) Colwood ranks on the lower end of the Canadian Active Living Environment Class.
- Shifting modes of transportation: While the number of commuters decreased 7.5% in 2020, and data shows that 85.1% of residents commute to work by vehicle, 2.4% commute to work by bicycle and the number of registered vehicles per household is decreasing (1.73 in 2016 to 1.39 in 2021). Most commuters (29%) leave between 7 and 8 am, 40% have a 15-29 minute commute, 29% have a 15 minute commute or less, and 24% have a 30-44 minute commute. Both the Ideas Fair and the Citizen Survey identified traffic and transportation as an issue of concern for residents.
- Low crime rates: Colwood has consistently lower crime rates than BC, however community safety was identified as an important issue in the Citizen Satisfaction Survey.
- Access to health care is a provincial challenge: 65% of BC's population are attached to a general practitioner nad 75% are attached to a group practice.
Additional survey themes
In addition to the findings of the Household Prosperity Report, a number of themes were identified at the Ideas Fair and through the Citizen Satisfaction Survey that the Household Prosperity Survey could delve more deeply into. For example:
- Recreation – hearing from residents about their recreation interests to help the City prioritize investments recommended through the Parks & Recreation Master Plan
- Seniors outdoor and indoor activities – understanding the types of facilities seniors would value and in what locations
- Youth facilities and activities – clarifying what types of facilities and activities youth would be most interested in and benefit from
- Citizen interest in volunteering – further defining the opportunities residents would be interested in and understanding the benefits they would like to derive from the experience
- Community groups – seek information about where there are opportunities to being people with a common interest together to create social connection and advance the goals of our community
- Neighbourhood connections – gather ideas to support healthy, welcoming, and connected neighbourhoods residents are proud to call home
- Enhancing accessibility – identify priority areas for accessibility improvements in decisions related to land use, housing, transportation, recreation and other aspects
- Health – gaining an understanding of how the municipality can best support the health of residents, for example by focusing on infrastructure and recreation that supports a healthy lifestyle, exploring incentives to attract doctors, or zoning changes to encourage construction of health care facilities
- Food security – understanding residents’ concerns about food security and gathering ideas about steps the City might take to address it
Read the full 2023 Colwood Household Prosperity Report [PDF/8.6MB].